

Periodically, the U.S. Census Bureau releases commutation data which shows commuting patterns among localities throughout the United States. Recently, I wrote blogs highlighting commuting patterns throughout the entire West Piedmont Planning District and many of its constituent localities (see https://ridesolutions.org/west-piedmont/ and scroll to the bottom of the page). This week, I focus on commuting patterns for Pittsylvania County in 2018, the latest year for which the commuting data are available. The data obtained for this analysis was obtained from the U.S. Census Bureau’s OnTheMap website, https://onthemap.ces.census.gov/.
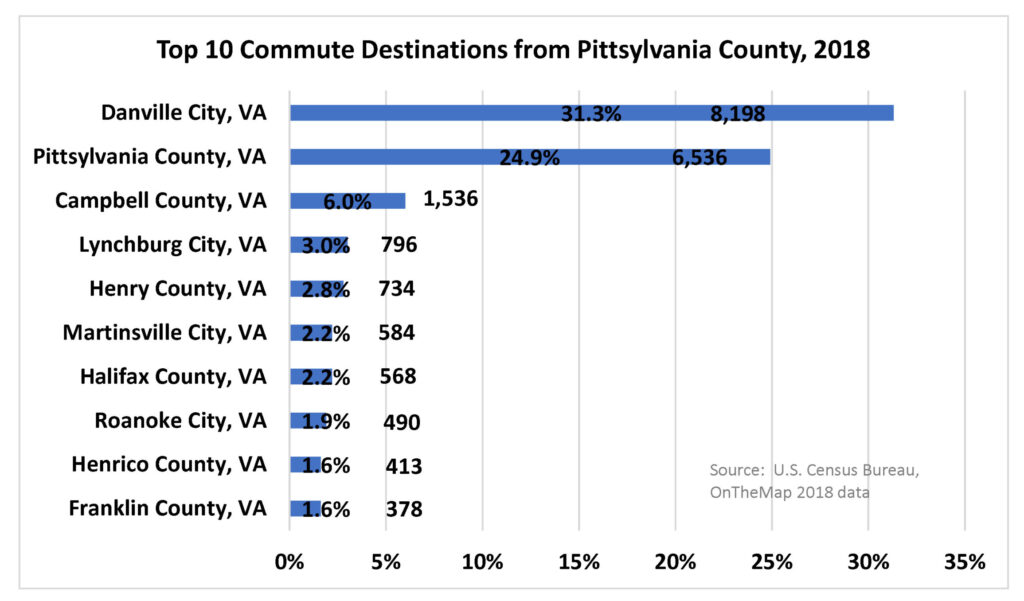
The figure directly below shows the localities in which workers residing in Pittsylvania County were employed in 2018. Serving as a suburban community to the City of Danville, it is no surprise to see that the greatest share of workers residing in Pittsylvania County (31.3 percent) commuted to Danville. The locality having the second-highest share of in-commuters from Pittsylvania County was the County itself, which is also not a surprise. After Danville and Pittsylvania County, the successive localities to which workers residing in Pittsylvania County commuted to were Campbell County (6.0 percent), the City of Lynchburg (3.0 percent), Henry County (2.8 percent), and the City of Martinsville (2.7 percent).
The radar graph immediately below shows the distances and directions employees earning up to $1,250 per month ($15,000 annually) and who resided in Pittsylvania County traveled in 2018. The graph shows that most traveled toward the northeast, followed by the south, and the east. Many workers traveling south had likely been traveling to Danville. An interesting observation is that a significant share of those employees traveling east and especially northeast, traveled more than 50 miles to work. As the above graph showing the top 10 employment destinations of workers residing in the County reveals, 413 workers commuted to Henrico County, located just outside Richmond. Not shown in the above graph is that 241 persons, representing 0.9 percent of the outcommuting workforce, commuted to the City of Richmond. Taken together, then, the City of Richmond and Henrico County employed 654 workers, or 2.5 percent of total outcommuters residing in Pittsylvania County. Another interesting observation is that 2,524, or 38.7 percent of the workforce earning up to $15,000 per year traveled more than 25 miles for work.
![]()
The following radar graph shows the distance and directions workers who resided in Pittsylvania County earning $1,251 to $3,333 per month ($15,012 to $39,996 annually) traveled in 2018. In contrast to the above radar chart, which shows distance and direction of workers earning $15,000 per year or less, a greater share of workers depicted in the graph below traveled to the south and southeast. Like the above chart, a large share of employees falling within this income category traveled to the northeast. A total of 3,286 (32.3 percent) employees earning between $15,012 and $39,996 traveled at least 25 miles for work.
![]()
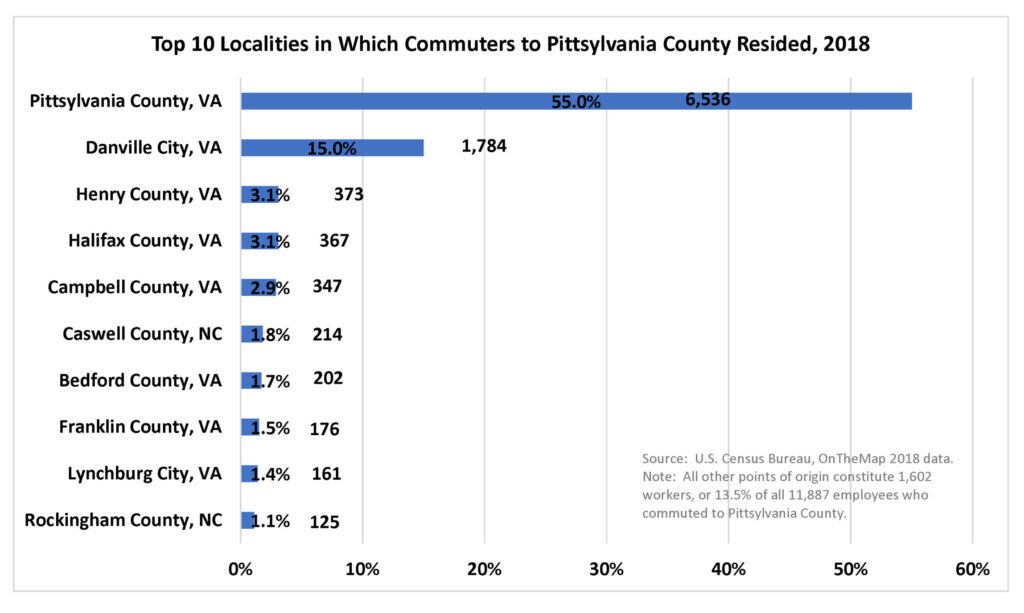
The figure immediately below indicates the top 10 localities from which commuters who were employed in Pittsylvania County resided in 2018. The greatest share (55.0 percent) resided in Pittsylvania County itself, followed by the City of Danville (15.0 percent). Following this, (3.1 percent) resided in neighboring Henry County; followed by Halifax County (3.1 percent); Campbell County (2.9 percent); Caswell County, NC (1.8 percent); Bedford County (1.7 percent); Franklin County (1.5 percent); the City of Lynchburg (1.4 percent); and Rockingham County, NC (1.1 percent).
The following radar graph shows the distances and directions workers employed in Pittsylvania County in 2018 and earning up to $1,250 per month ($15,000 annually) traveled to get home. The graph shows that most traveled south toward Danville and North Carolina, with the second highest share traveling north.
![]()
The radar graph below shows the same information as the above radar graph in terms of distance and direction of travel from Pittsylvania County to home counties, but for employees earning $1,251 to $3,333 monthly (which works out to $15,012 to $39,996 annually). Like the above radar chart, the chart below shows that most workers employed in Pittsylvania County traveled south toward Danville and North Carolina, followed by the north and northeast.
Whether your current commute consists of carpooling, transit, telecommuting, walking, or biking, don’t forget to log your trips in the RIDE Solutions app, which you can download for FREE at ridesolutions.org today!
![]()