

Periodically, the U.S. Census Bureau releases commutation data which shows commuting patterns among localities throughout the United States. Recently, I wrote blogs highlighting commuting patterns throughout the entire West Piedmont Planning District, Franklin County, the City of Danville, and the City of Martinsville and Henry County (see https://ridesolutions.org/west-piedmont/ and scroll to the bottom of the page). This week, however, I focus on commuting patterns for Patrick County in 2018, the latest year for which the commuting data are available. The data obtained for this analysis was derived from the U.S. Census Bureau’s OnTheMap website, https://onthemap.ces.census.gov/.
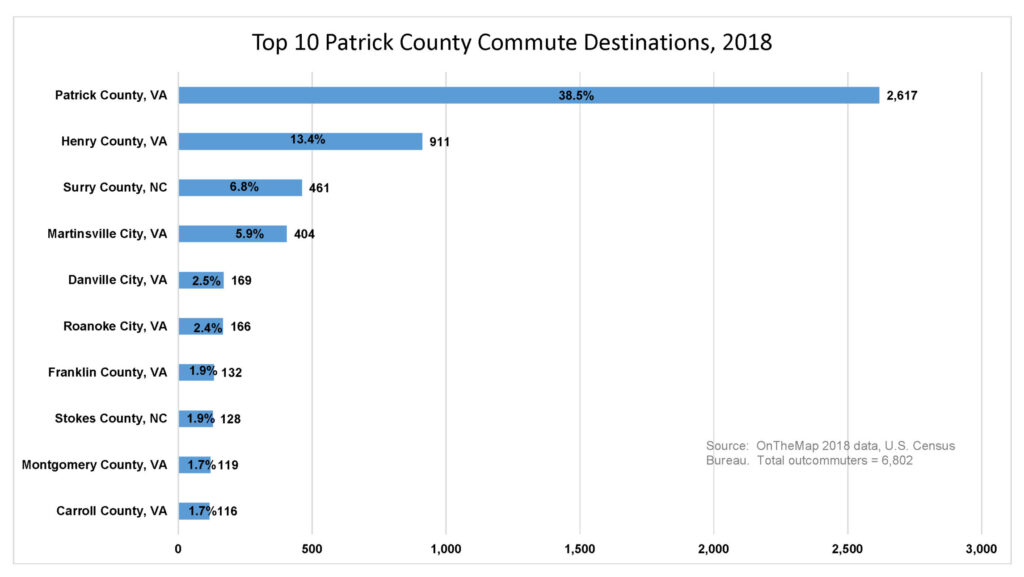
The figure below shows the top ten commuting destinations for workers residing in Patrick County in 2018. Not surprisingly, the greatest share (38.5%) of workers based in the County also commuted within the County for work. The second-highest share of commuters residing in the County (13.4%) commuted to Henry County. This is not surprising, since Henry County serves as a major employment center in the West Piedmont Planning District, and accommodates Patriot Centre and Martinsville Industrial Parks, and Commonwealth Crossing Business Centre. Other important work destinations of workers residing in Patrick County included Surry County, NC (6.8%); the City of Martinsville (5.9%); the City of Danville (2.5%); the City of Roanoke (2.4%); and Franklin County (1.9%).
The radar graph below shows the distance and direction of workers who earned up to $1,250 per month and resided in Patrick County and commuted from the County in 2018; $1,250 per month translates to $15,000 per year. The graph shows that most workers falling into this income bracket commuted either to the east or northeast. Therefore, it could be assumed that workers had commuted to Martinsville, Henry County, Rocky Mount, Danville, or Pittsylvania County. The figure also indicates that 582 workers, representing 34.0 percent of workers in this earnings category, traveled at least 25 miles for work, with more than 17 percent traveling at least 50 miles.
![]()
The following radar graph shows similar information as in the radar graph above, but it represents a higher income category of $1,251 to $3,333 per month, which equals $15,012 to $39,996 annually. Like the radar graph above, the graph below shows that most employees in this higher income category traveled to the east and northeast for work. A total of 864 employees (28.3 percent) in this income bracket traveled at least 25 miles to get to work, with nearly 400 (13.1 percent) traveling at least 50 miles.
![]()
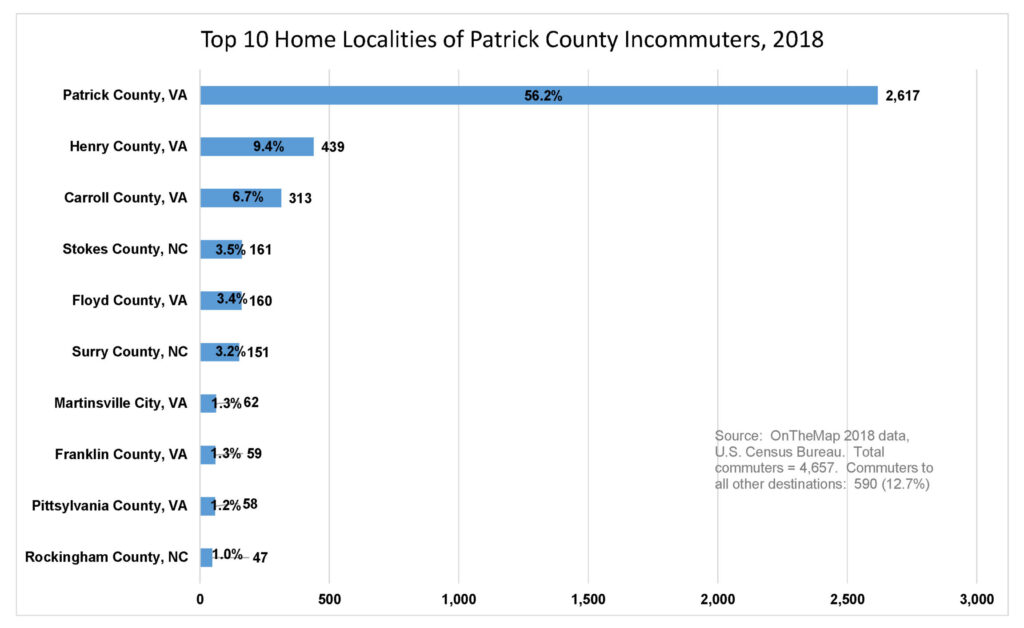
The figure below shows the top ten localities in which incommuters to Patrick County resided in 2018. Again, it is no surprise that the majority share (56.2%) of commuters who worked in Patrick County also resided in Patrick County. Other localities which housed Patrick County workers and incommuters in 2018 included Henry County (9.4%); Carroll County (6.7%); Stokes County, NC (3.5%); Floyd County (3.4%); Surry County, NC (3.2%); the City of Martinsville (1.3%); and Franklin County (1.3%).
The radar graph below shows the distance and direction workers employed in Patrick County earning $1,250 per month or less ($15,000 per year) traveled home from their jobs in the County. The figure shows that the majority of workers traveled east as part of their commute home, with smaller, albeit significant directions to the west and northeast also shown. A total of 288 workers (22.6 percent) were traveling at least 25 miles to get home from Patrick County, with 121, or 9.5 percent, traveling at least 50 miles on their trip home.
![]()
The following radar graph shows the distance and directions workers employed in Patrick County earning $1,251 to $3,333 per month ($15,012 to $39,996 per year) traveled to from work in the County. As was the case with the lower income bracket ($1,251 or less per month), most of these workers resided either east, west, or northeast of Patrick County. Additionally, 464 individuals (nearly 20 percent) traveled at least 25 miles between work and home, with 171 (7.3 percent) traveling at least 50 miles between work and home.
![]()
If your commute involves carpooling, transit use, bicycling, walking, or telework, don’t forget to log each trip or telework session into the RIDE Solutions app, through which you will earn points toward great rewards for every trip (or telework session) you take! Rewards consist of discounts on dining, shopping, and activities, as well as the opportunity to participate in raffle drawings to win great prizes! If you haven’t done so already, download the FREE RIDE Solutions app today at ridesolutions.org! It’s extremely easy to become a RIDE Solutions member. All you do, when prompted, is enter your first and last name, your email address, and a password. That’s it, and you’re done!